

Products · Marketing System Operation
MSO Platform: The Gap After the Dashboard
Marketing has enough data, dashboards and AI tools. What is missing is a system that turns data into decisions and keeps the lessons.
Fragmented interpretation
One GMV drop, three readings: Media wants budget, Social wants new creators, E-commerce wants new pricing.
BI shows the numbers. No system runs the step to a shared diagnosis.
No market context
Is the category falling, or only the brand? What did competitors change? Which creators are rising?
Internal BI sees internal data. The market sits outside the warehouse.
Lost organizational memory
Results get reviewed, but not the assumptions, rejected options and expectations behind each decision.
Dashboards don't store decisions, so knowledge leaves with people and agencies.
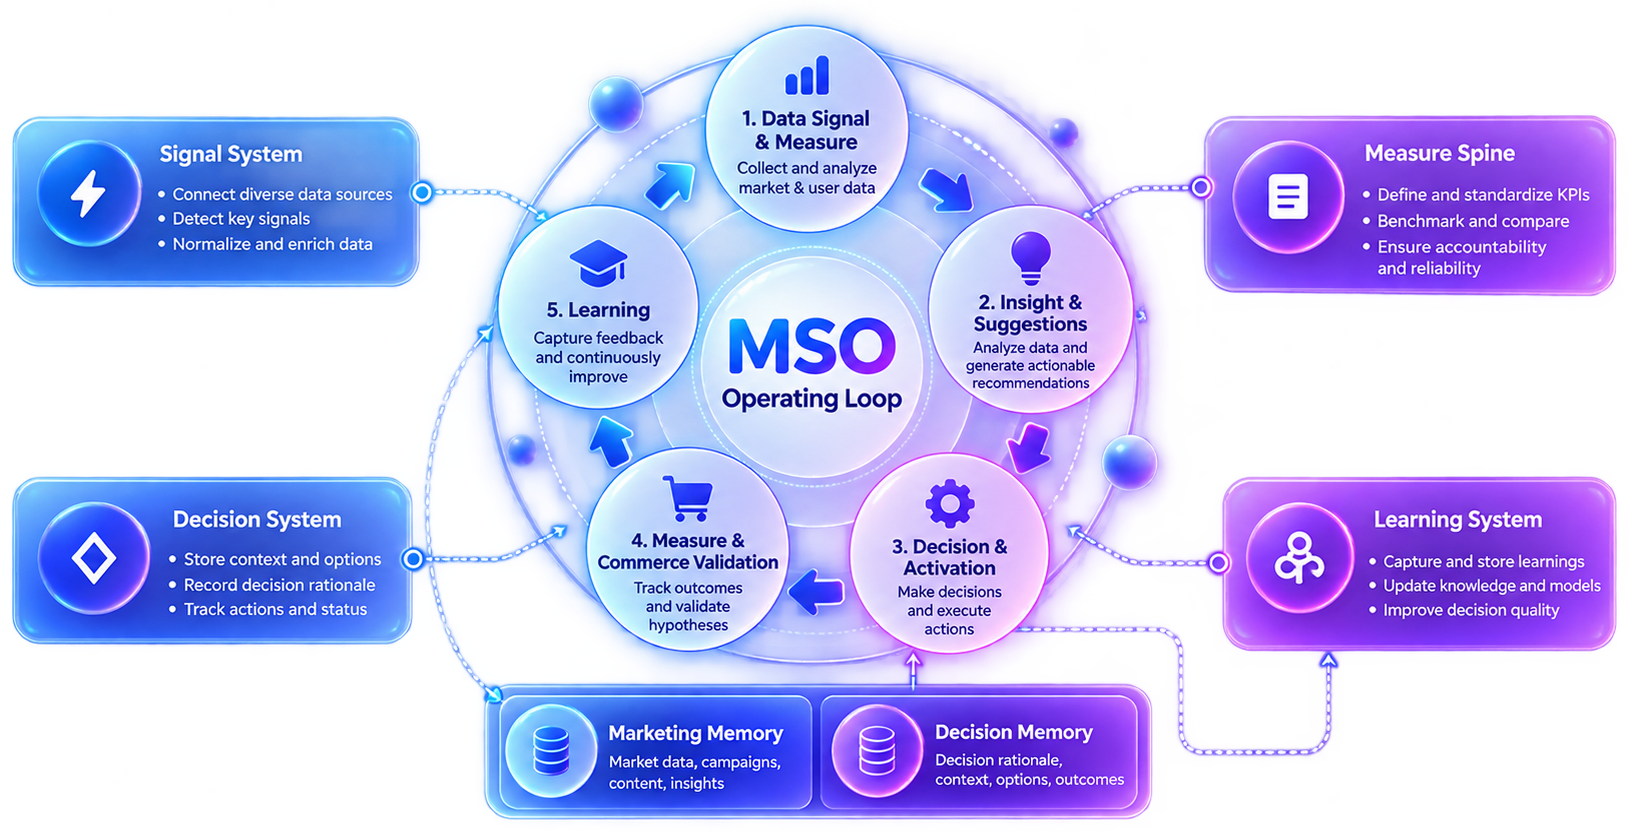
Operating loop
Signal & Measure
Detect market signals
Insight & Suggestion
Analyze, propose actions
Decision & Activation
Decide and act
Commerce Validation
Measure outcomes vs. plan
Learning
Feeds the next cycle
Powered by four systems
Signal System
Connects sources, detects key signals, normalizes and enriches data
Measure Spine
Standard metric definitions, benchmarks and consistency
Decision System
Stores context, options and rationale; tracks actions
Learning System
Keeps lessons, updates models, improves decisions
Outputs for decision-making
Data sources
Seller Center & e‑commerce
Media ads
Social listening
Creators & People Media
CRM & internal systems
MSO
Unified Intelligence
Connects to existing infrastructure; does not replace it
Customized dashboards
Shared KPIs and benchmarks for every department
Market & competitors
Category and competitor moves vs. brand performance
AI assistants
Q&A and findings grounded in connected data
Decision support
Diagnosis, recorded decisions, evidence-based playbooks
Rollout & deployment

Phase 1 · L1A–L1B
Pilot
Connect sources, standardize metrics, build team dashboards, configure AI assistant and playbooks, run signal → diagnosis → approved action

Phase 2 · L2
Scale
Record decisions across teams, compare expected vs. actual each cycle, quarterly reviews and playbook tuning

Phase 3 · L3
Mature
Recommendation logic tuned on the brand's verified decision history, co-designed with YouNet
Pilot success criteria
Signal-to-diagnosis time, % decisions fully recorded, % reviewed on time, team adoption
What we need from you
A decision-making owner, data access via API, connector or upload, a fixed review rhythm
Cloud or on-premise
Cloud for fast rollout; on-premise for strict data control and security